Curtailment, or why Australia can give everyone three hours of free solar power during the day
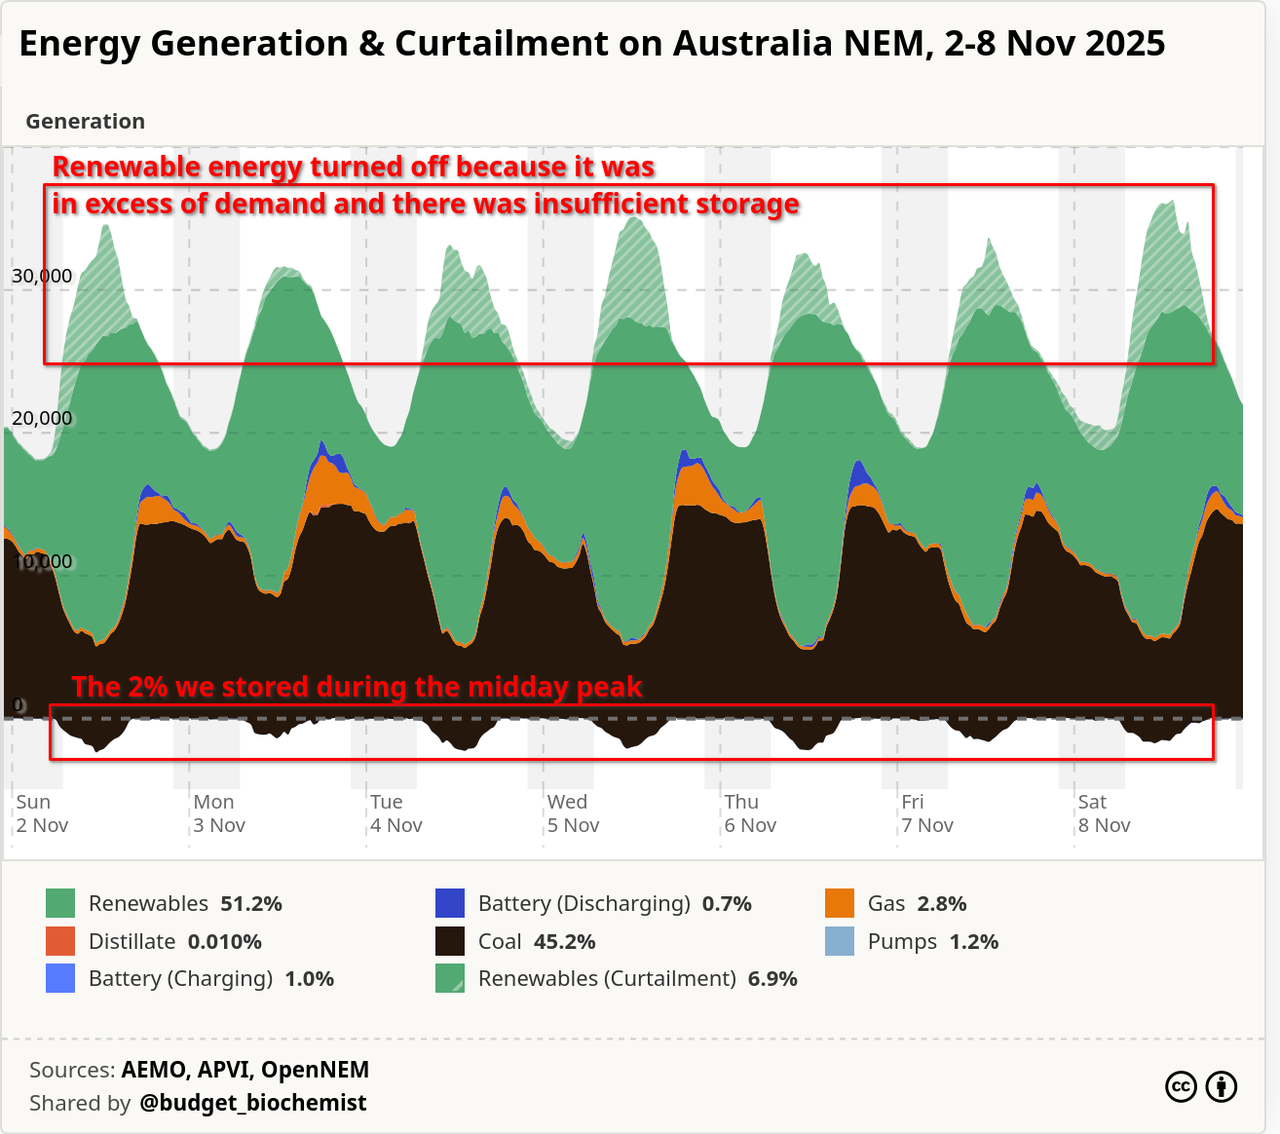
I annotated this chart to show the huge gap between the curtailed (wasted) renewable power at midday in Australia and the storage available to make use of it. Hence the recently announced Solar Sharer Scheme, which will give Australians three hours of free power in the middle of the day.
The highlighted white-green parts on top of the chart are the renewable generation capacity that was unused because it couldn’t be stored but the coal power generators couldn’t be turned off. That capacity is equivalent to 6.9% of actual generation. The coal usage in that time was 45.2% - so it could have been reduced by about a sixth to only 38.3% if we made better use of renewable power.
The small blobs below the zero line are the power that was stored (in batteries or pumped hydro), only 2.2% of total generation. If we were storing all the renewable capacity we would have stored 9.1% - over 4 times the current amount.
The chart was exported from OpenElectricity and annotated with Gwenview. Here is the 7 day chart from OpenElectricity showing wind and solar curtailment seperately (for the last 7 days).