Renewable Electricity Curtailment on the NEM Recently
Electricity Generation, Australian National Energy Market, Friday 26 and Saturday 27 September 2025:
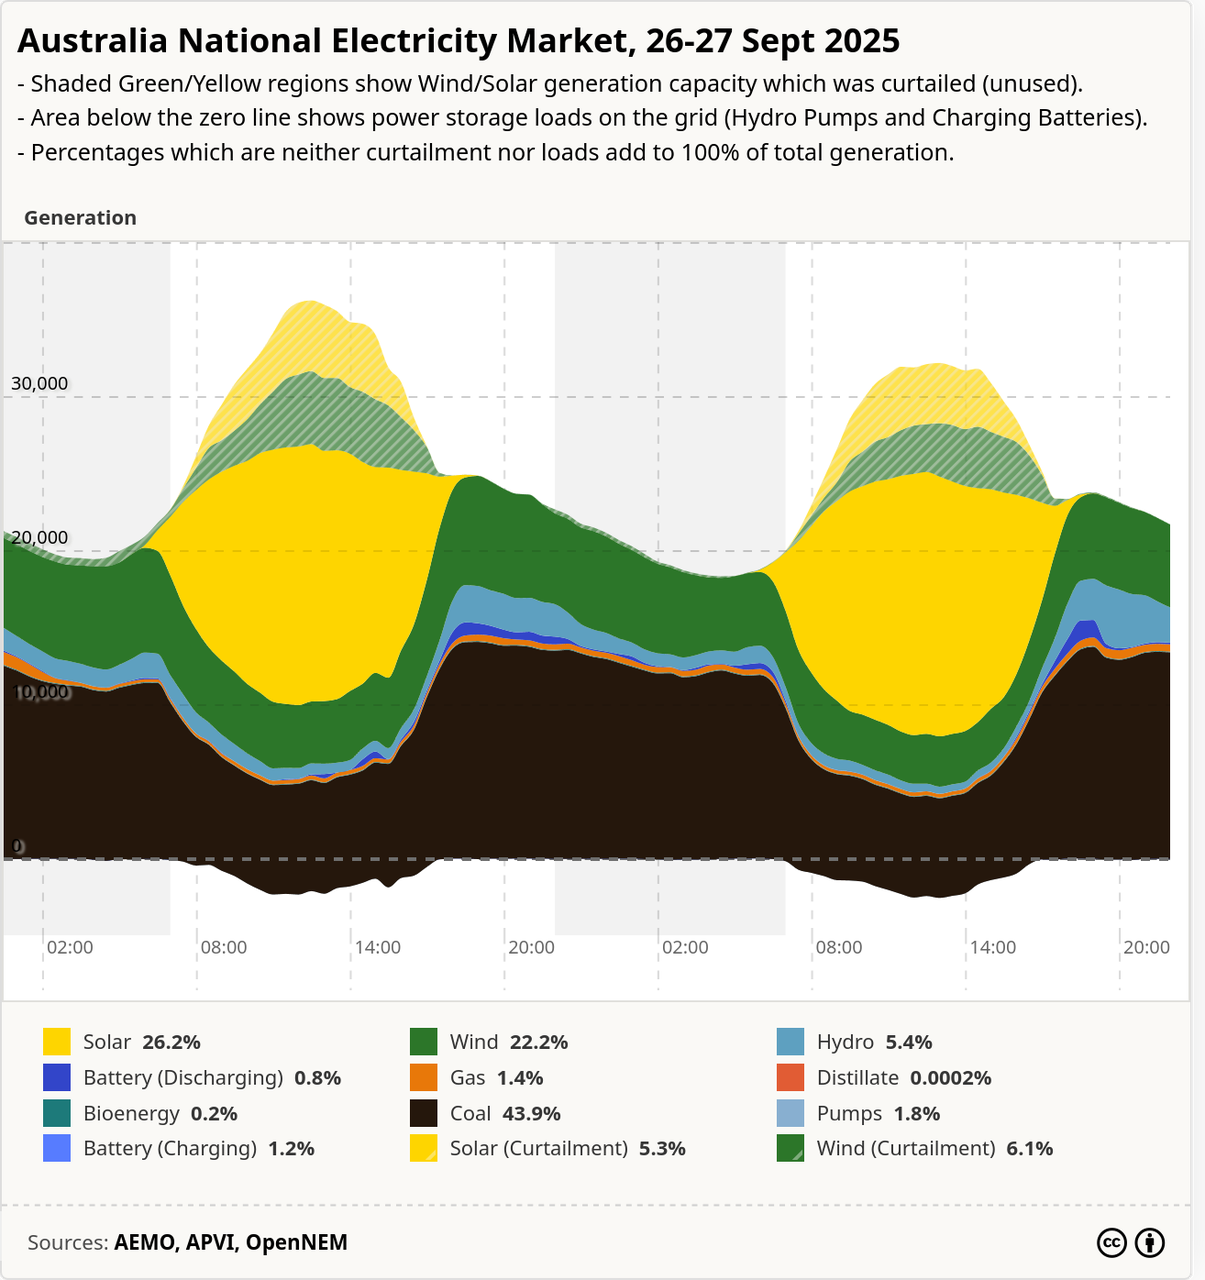
The shaded green and yellow caps on top are the wind and solar generation capacity that was unused because it couldn’t be stored and other power generators couldn’t be turned off. As percentages of total consumption, 6.1% wind and 5.3% solar was curtailed (vs 22.2% of wind and 22.2% of solar that was consumed).
Put another way: We were 43.9% powered by coal in that time, but could have been using only 32.5% coal if all the curtailed solar and wind had been utilized or stored.
The area below the zero line shows power that was stored (in batteries or pumped hydro, respectively only 1.2% and 1.8% of total consumption).
The chart was exported from OpenElectricity. A more detailed 7 day chart is also available.